Pre-Market Prep
Fundamentals
GameStop unexpectedly released its first-quarter results and announced a share-sale plan on Friday, coinciding with a renewed interest in the stock, sparked by the re-emergence of meme-stock influencer “Roaring Kitty.”
Q1 2024 Earnings Release
GameStop officially shared its preliminary Q1 2024 earnings results in a press release on its investor relations website this week. The company reported that its net sales for Q1 2024 are expected to range between $0.872 billion and $0.892 billion. This marks a decline from the $1.237 billion posted in GameStop’s Q1 2023 earnings results and fell short of Wall Street expectations, which estimated around $1 billion for GameStop’s Q1 2024 results.
Share Sale Plan
Alongside the earnings report, GameStop announced a plan to offer 75 million shares in an “at-the-market” sale, meaning the shares would be sold at the current market price. This follows last month’s announcement of the sale of 45 million shares, which generated $933.4 million.
Revival of Meme-Stock Mania
The meme-stock frenzy has been reignited in recent weeks after Keith Gill, the headband-wearing investor known as “Roaring Kitty,” resurfaced on social media after a nearly three-year hiatus. Gill recently disclosed that he has taken a new, substantial position in GameStop. On Friday, he held his first livestream since 2021 on his “Roaring Kitty” YouTube account, further fueling interest and speculation around the stock.
As GameStop navigates these developments, the market’s response to both the earnings results and the share sale plan will be closely watched. The influence of high-profile investors like “Roaring Kitty” continues to play a significant role in the stock’s volatility and overall market perception.
Technicals
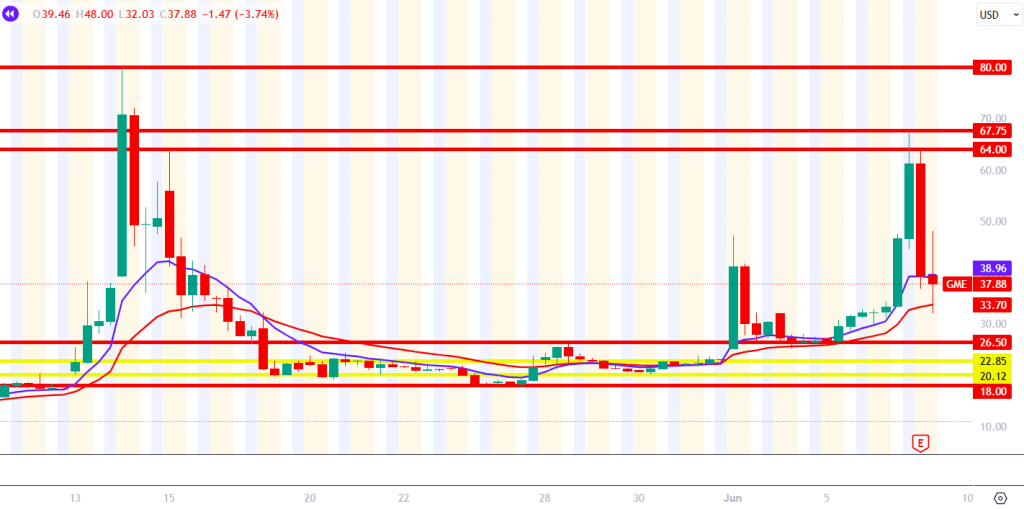
GameStop experienced a significant push towards the $64.00 to $67.75 levels but saw a strong sell-off in the pre-market following the release of its negative earnings report. Here are the key levels observed on the chart:
Upside Levels:
- $80.00: This level marks the 52-week high for GameStop and serves as a critical point of resistance.
- $67.75: Tested in the post-market, this level was another key area of resistance.
- $64.00: This was the starting point of the pre-market sell-off and also a previous resistance area back in May.
Downside Levels:
- $26.50: This level represents the breakout point of a prior consolidation and has turned into a support level.
- $18.00: This marks the bottom of the previous consolidation.
Intermediate Levels:
- $22.85 and $20.12: These yellow lines indicate a smaller consolidation area within the broader consolidation range.
RVOL:
- Volume is trading at around 7 times the normal (RVOL ~7).
As GameStop’s stock reacts to the latest earnings results, these levels will be crucial for traders to monitor. The stock’s movement around these points could provide insights into potential future trends and market sentiment.
VWAP Strategy
- The stock is trading at high RVOL in the premarket (At least > 2)
- The stock should have a good news catalyst.
- The stock should have a powerful opening drive.
- Pullback to VWAP on lower volume than the opening drive.
- Push a way from VWAP (wicks on the candle).
- RVOL should still be elevated during the trade.
- Stop loss initially will go above VWAP but move the stop loss down after each new prominent high/low.
Post Trade Review
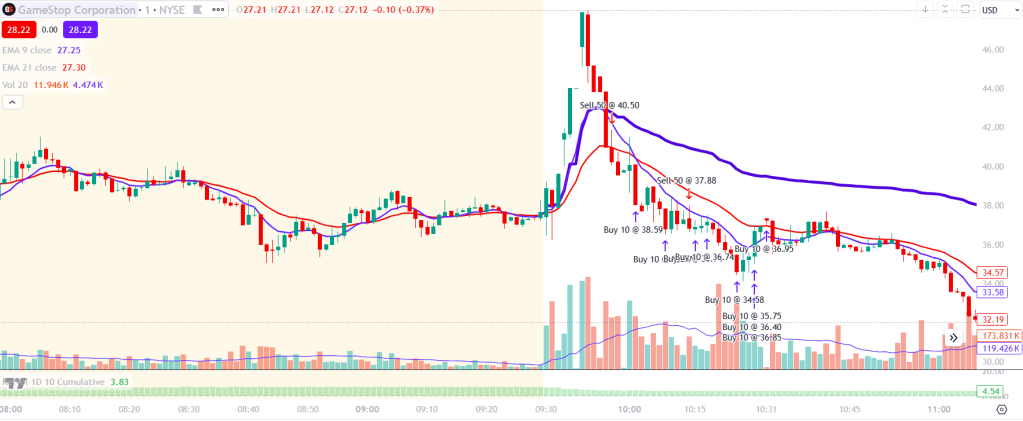
We had a very strong opening drive to the upside, trading at such high volume that trading was halted twice during the initial surge. As the price began to pull back to VWAP, I initially looked for a potential bounce to go long, but the stock crashed directly through VWAP, indicating no buying interest at that level. I shifted my strategy from considering longs to shorts. However, given the stock’s volatility, I was cautious about shorting immediately after the VWAP break.
I waited for the next candle to approach VWAP, but it quickly moved away, which suggested strong selling interest near VWAP. Additionally, the VWAP curling down was another bearish indicator. I shorted 50 shares at $40.50, with a stop-loss set at around $43.00. I was uncomfortable with the risk I was taking on, which is why I only shorted 50 shares, bringing my total risk to $125, or around 20% of my daily limit of $500 (1% of my trading account).
To mitigate risk, I covered 1/5 of my position at $38.59 and another 1/5 at $36.77, driven more by fear of a reversal than necessity. After observing low-volume consolidation, I shorted another 50 shares at $37.88, setting a tight stop at $38.50. My reasoning was that if we were truly in a downtrend, the stock should continue to decline. It did, but I bought back 30 shares prematurely because the trade took longer to unfold than I anticipated. In hindsight, I should have stayed in.
At this point, I am still holding 50 shares. I bought back 10 shares at the bottom of the drop and gradually covered the rest as I observed significant bullish candles crossing above the 9 and 21 EMAs, indicating a potential reversal.
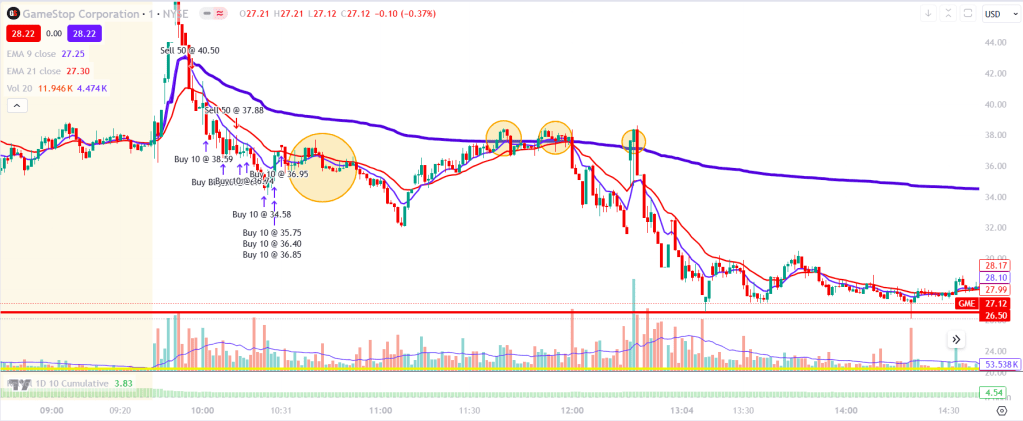
The figure below highlights other areas where I should have considered entering the market. I was playing it conservatively because I didn’t want to risk my trading profits, especially on what was my best trading day of the year. There was a clear low-volume consolidation where I could have taken a short position. Additionally, prices crossed over VWAP three times but failed to hold. You can also see that the price eventually returned to the top of the breakout range. I left a lot of money on the table by not re-entering at these points and should have been more attentive to these opportunities.
Three things I really need to work on:
- When I fully exit a position, I need to be comfortable re-entering if the opportunity presents itself.
- I also need to be comfortable trading stocks that experience multiple trading halts throughout the day.
- To improve my trading strategy, I should continue reviewing the tape on these trades to identify any patterns or similarities that could provide an edge in the future.

Leave a reply to June 17, 2024 – AAPL – Anthony Trades Cancel reply