Pre-Market Prep
Technicals
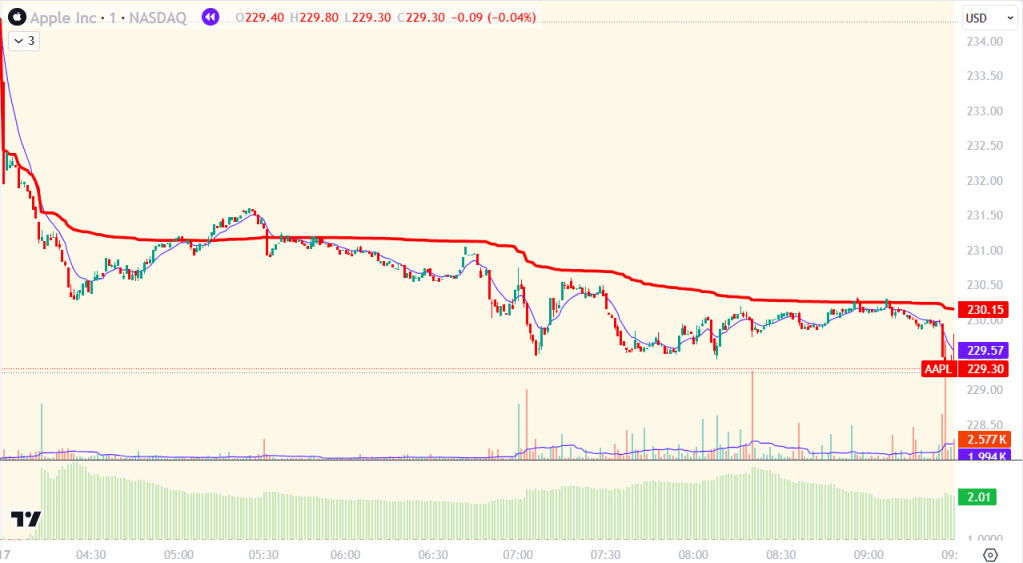
AAPL was trading at 2-2.5 RVOL in the pre-market. There was talk of Biden putting restrictions on exports of semiconductors, so there was a large sell off of the semis and tech stocks. What interested me was that even after the gap down, price was holding under VWAP. As you can see on the 1-minute chart in the pre-market, price kept rejecting VWAP, a sign to me that sellers are in control.
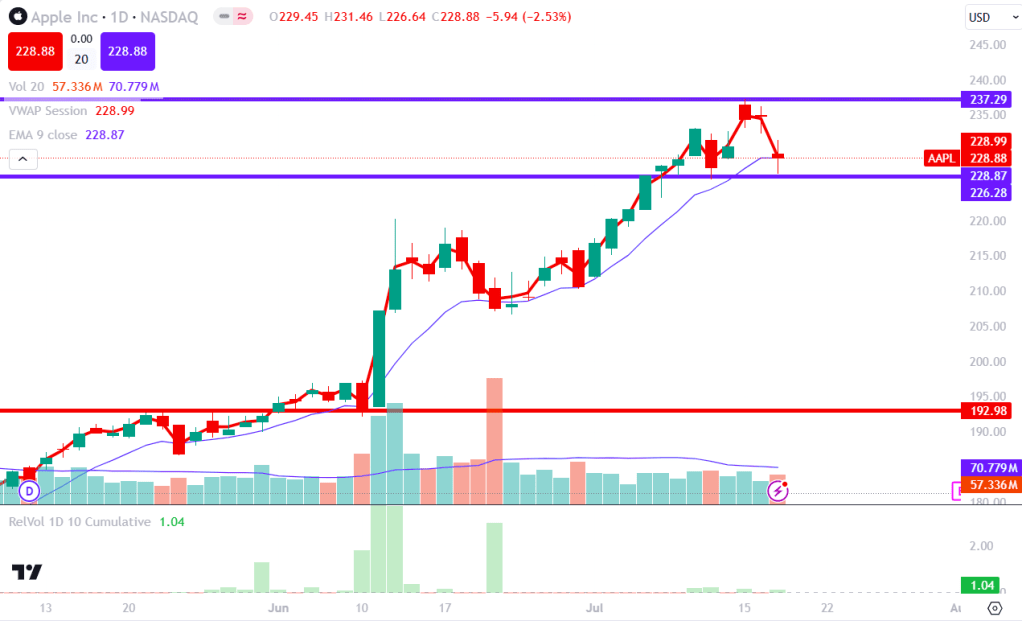
On a daily chart, you can see that we rejected the high at around 237, and then gapped down. I had that 226-level marked since we tested that a few times previously. If price kept going lower, this would be a good target.
Post Trade Review
AAPL had a strong opening drive to the upside, and after holding VWAP for a few minutes, it came crashing down with no buyers in sight. I entered on the first candle that closed below VWAP and then doubled my position after the second candle wicked off of VWAP. I took off half my position at the bottom of the large move down, and then closed out of my position in full after we broke the previous candles high.

This is by far my favorite pattern to trade, especially when it is this clear. I had a very similar trade on June 7, 2024 – GME and June 24, 2024 – NU (although I didn’t trade NU) the pattern was still there. Below I want to show the three occurrences so we can compare the similarities between the patterns.
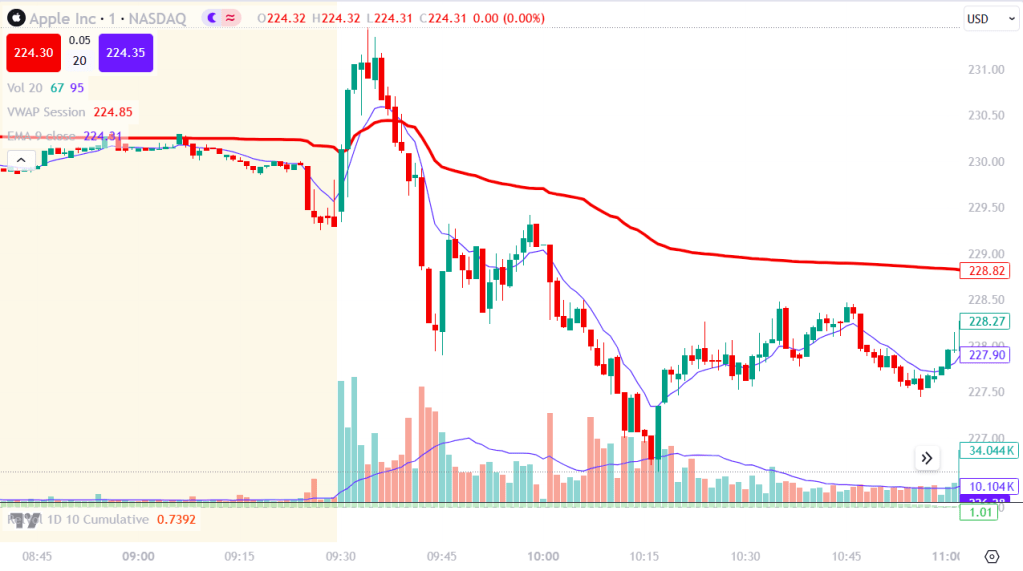
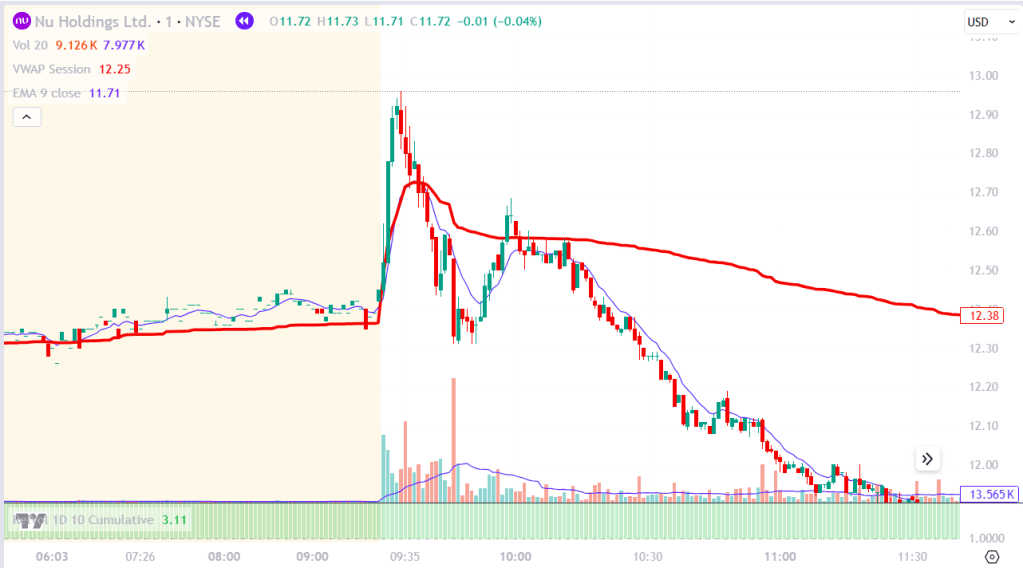
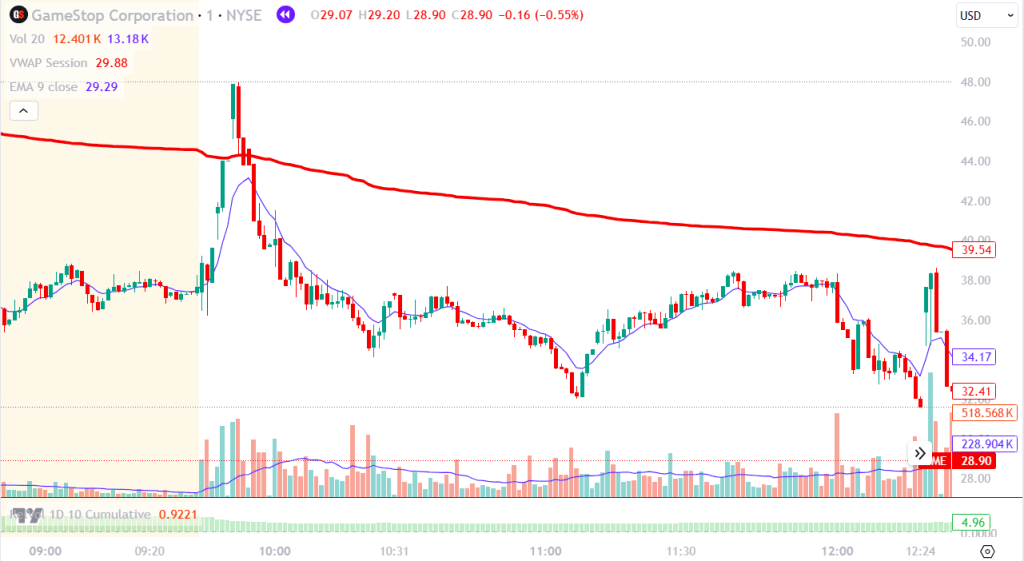
These are extremely similar patterns and easy to identify. Let’s break down their components. First, we have a very strong opening drive. But what does that mean? By just looking at it we can see that price clearly moved in one direction off the open. There wasn’t higher highs and high lowers (trending), instead there was consistent buying pressure with no sellers in the way. Technically speaking, GME and NU both did more than a full ATR off the open (GME ATR was 7.50 and it moved 10.47; NU ATR was 0.45 and it moved 0.5). AAPL did about half an ATR (AAPL ATR was 5 and it moved 2). I will need to continue to build this data set to see if stocks that move an ATR or more off the open have more expected value than those that do not.
In almost all cases, after the immediate sell off under VWAP, we start to pull back and sometimes get back to VWAP to reject again. In other cases, we do not even make it back that far. I think there is value in holding part of the position during the pullback and expecting another leg lower. I want to add a collection of these screenshots to a folder, so that I can begin to ingrain the pattern in my mind. Eventually, I’ll recognize the pattern as it is happening in real time and will not hesitate to enter a trade.

Leave a comment