Pre Market Prep
Fundamentals
NVDA continues to experience a wave of bullish sentiment following last week’s positive earnings report. On Friday, the stock closed at an all-time high, and by the pre-market session on Tuesday, it was gapping up by 3.5%.
Despite the absence of any significant recent news beyond the earnings report, the outlook for NVDA remains very optimistic. News articles published before and during the market open have been consistently positive, highlighting the company’s strong growth trajectory and potential for higher prices.
Technicals
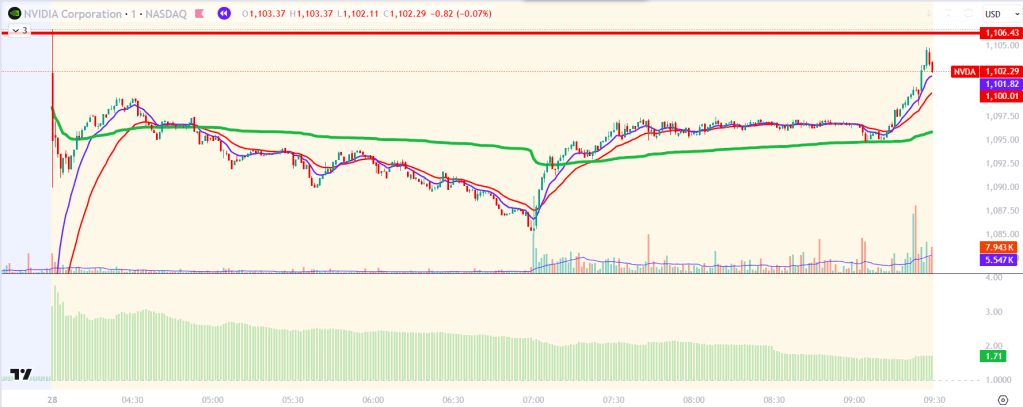
NVDA opened the pre-market at 1,102.16, marking a 3.5% gap up from its close on Friday. I identified this high with a red line, viewing it as potential resistance heading into the market open. During the early pre-market session, the Relative Volume (RVOL) was notably high, hovering around three times the usual volume and maintaining about 1.5 times the usual volume as the market open approached.
Due to the gap up and elevated RVOL, I anchored the VWAP represented by the green line, to the opening pre-market candle. This was based on the assumption that it would accurately reflect strong buyer activity leading into the open. Additionally, I tracked the 9 EMA with a blue line and the 21 EMA with a red line to monitor the trend.
VWAP with 9/21 EMAs Strategy
The strategy is to long after price comes into VWAP and holds or bounces off. Preferably, I will wait for confirmation when price begins to trade above the 9 and 21 EMAs. I will also close out of the trade when price closes below the 21 EMA. I do this because I use these EMAs to track the trend, and if they do not hold then I do not want to be in the trade.
Post Trade Review
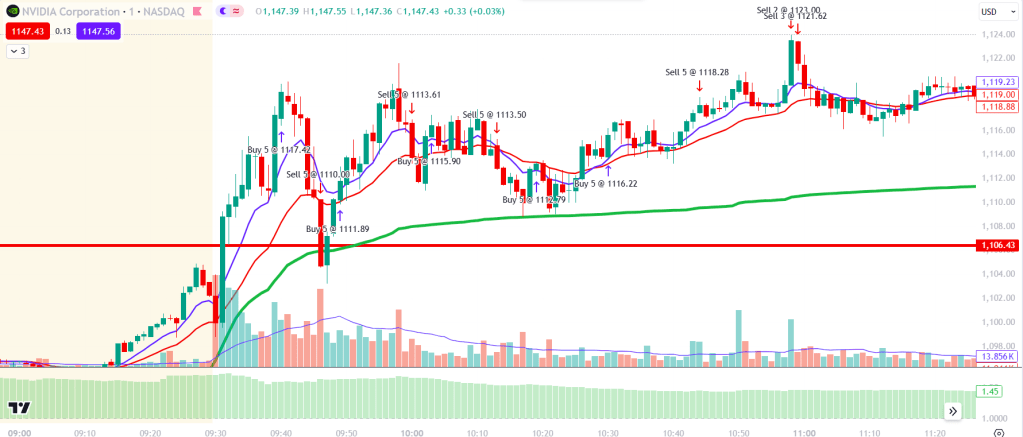
The market opened and immediately moved away from VWAP, holding the 9 EMA quite well. At 9:40, we saw a strong move up with large volume, and I entered right after this candle closed. However, this move carried significant risk and resulted in my biggest loss of the day. I believed the price had potential for a significant rise, but instead, we saw immediate selling down into the anchored VWAP. The price then bounced off the anchored VWAP, but I hesitated to buy immediately due to the heavy volume on the previous large bearish candle. I entered the trade as the price closed above the 9 EMA, but exited a few minutes later when it closed below the 21 EMA.
Price continued to consolidate around the EMAs, leading me to enter long again, only to be stopped out. Going forward, I’ve learned not to enter during consolidation with the hope that the price will move in my favor. Instead, I will wait for a break in consolidation. After being stopped out, the price moved down to the VWAP and bounced perfectly. I entered long and placed my stop below the swing low that touched VWAP. When the price touched VWAP again and moved through the EMAs around 10:30 am, it began to consolidate at lower volume. I entered long with another 5 shares after that push up because I liked the setup, and The Playbook teaches to be aggressive in your A+ setups.
I took half off sensing some selling pressure, but in hindsight, I should have let the position ride as we were still trading above the 9 EMA, and there was no reason to exit. I went flat when we had a huge spike up around 11 am. This spike was uncharacteristic for the trend at the time and was immediately met with selling pressure. I would have closed out under the 21 EMA regardless.
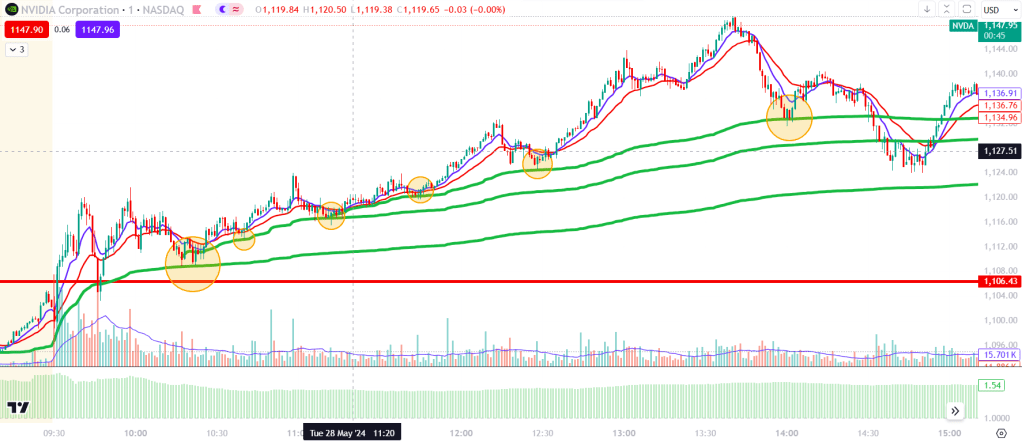
I stopped trading during the middle of the day to return to my 9-5 job. However, I noticed multiple setups using the anchored VWAP handoff method that Brian Shannon discusses in his book, Maximum Trading Gains with Anchored VWAP. When the price pulls into VWAP and begins trending again, we can anchor another VWAP to that point. The green lines represent three different VWAPs, and the circles indicate how often they are tested and respected. If I had held my core position from the first circle and added to my position and moved my stop up at each circle, I could have captured a significant move. Hindsight is 20/20.
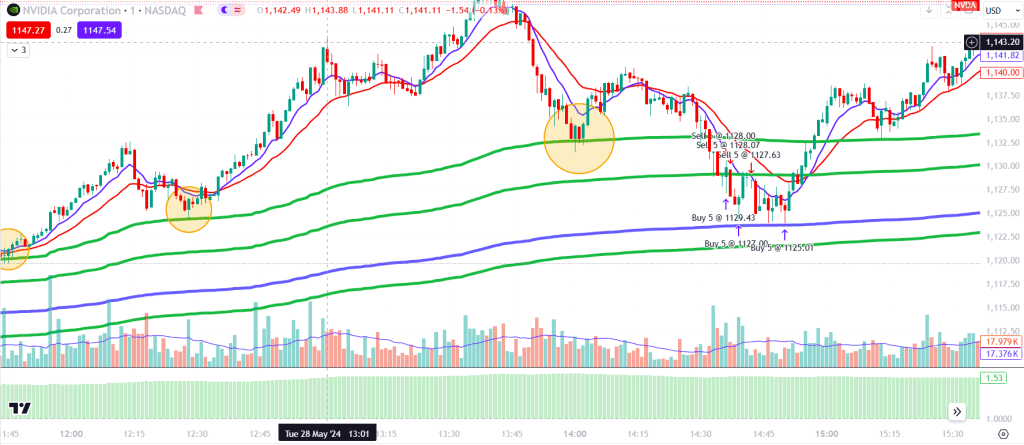
I placed a few more trades between 2:30 and 3:00 pm when I noticed we were crashing below the handoff VWAP, which usually does not hold as well as the main VWAP. I shorted under the break of the second VWAP, with my target set just above the first VWAP. I remembered that The Playbook discusses a “shot clock,” which is a specific amount of time within which a trade should work. This trade was expected to move directly to the first VWAP without hitting resistance, but it took much longer than anticipated due to encountering some resistance. In hindsight, I should have recognized that the trade was taking too long and exited.

Funnily enough, this was not some random resistance. The resistance occurred right at the VWAP anchored to the 9:30 am open (thick blue line). Going forward, I will always include this on my chart.
Overall, I was quite satisfied with this trade. It aligned with my understanding and I could clearly visualize the setup. Moving forward, I’ll persist in documenting these trades to refine my recognition of A+ setups. Additionally, I plan to implement a trading journal to track my P&L curve and other trading statistics. Stay tuned for more updates on this front.

Leave a comment