Pre Market Prep
Fundamentals
NVDA released its earnings on May 22, 2024, so we should monitor if there remains significant interest from participants looking to trade the stock on the second day after the announcement.
Technicals
The RVOL was relatively low during the premarket, hovering around 1.5 times the relative volume. I was hoping for higher activity. Notably, we were trading above the VWAP for most of the premarket session until a few minutes before the open, when a significant selloff occurred.
Strategy
Long if price action comes to the 2-day anchored VWAP and moves away quickly or holds and doesn’t break.
Post Trade Review
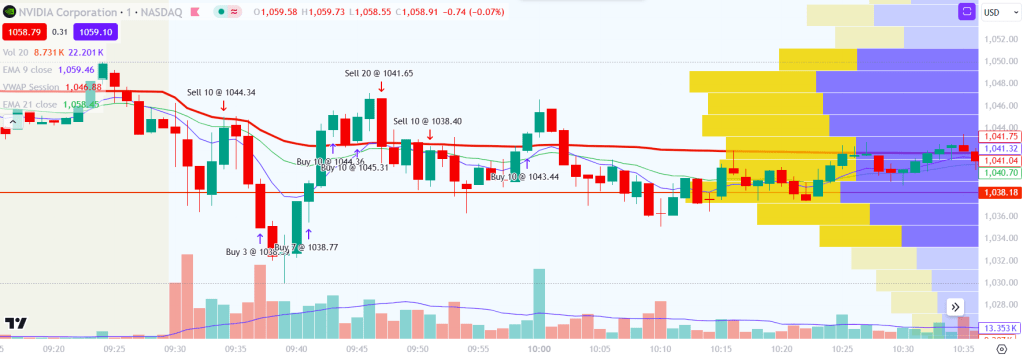
During the market open, I entered a short position as soon as the green candle touched the 2-day VWAP. I was filled at an excellent price, and initially, the trade moved in my favor. However, I eventually closed my position when the price crossed back above the key level marked by the horizontal red line. This level, significant due to the high volume from the previous day’s open, acted as a point of contention.
In hindsight, I wasn’t entirely satisfied with my first entry. It felt somewhat fortunate that the trade rejected the 2-day VWAP. Moving forward, I should wait for a confirmation candle before entering a trade.
A few minutes after my initial trade, I attempted to go long above the 2-day VWAP but was stopped out. I then switched to a short position after observing the price holding below the 2-day VWAP, yet again, I was stopped out. After these trades, I decided to stop trading for the day and returned to my 9-5 job. Interestingly, NVDA later made a significant move higher after touching the 2-day VWAP again.
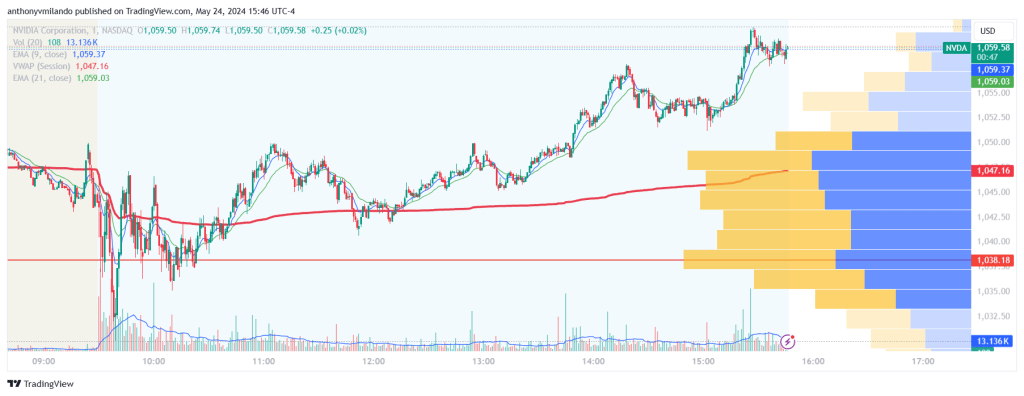
I may begin to avoid trading at the open and instead wait patiently for the VWAP. Although the market can make significant moves during the open, I often find myself caught in the midst of a battle between bears and bulls, making it unclear who is in control.
Reflecting on yesterday’s trades, I realized that the 9 EMA (blue line) and 21 EMA (red line) are quite helpful in identifying clear trends. Currently, I am backtesting the EMA crossover strategy to determine if it provides an edge in trend trading. More insights on this will be shared soon.

Leave a comment